At university, our stats exams were pretty much open-ended. I think there was a cap on one final exam at 6hrs and we were allowed any resources we wanted. Any number of books, notes, tables, food and drink was allowed although our lecturer drew the line on allowing students to slip out to the bar to bring back beer.
They were not so much interested in us getting the answer right (although that helped get better marks), but interested to see if we can select the correct test to use for the circumstances and justify why.
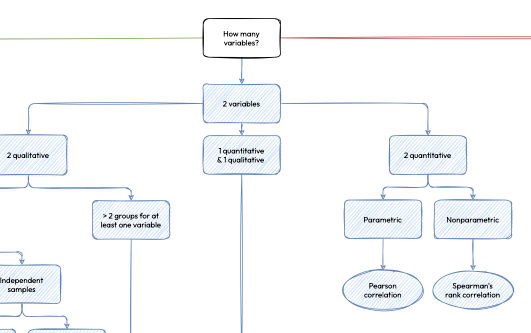
Once again Antoine Soetewey has created a great little blog on his site Stats and R with a flow chart for selecting an appropriate statistical test. Below is a link to the blog and I have also attached a direct link to the flowchart so that you can download it as a reference tool.
There are a couple of cautionary notes in his blog and the following are ones I think need to be reiterated:
- The chart does not cover every possible test, just the ones most commonly used.
- Tests of normality (a subject close to our hearts) and any subsequent decsion making and/or use of transformations are not included.
Enjoy!!
Blog
https://statsandr.com/blog/what-statistical-test-should-i-do/
Flowchart
https://statsandr.com/blog/files/overview-statistical-tests-statsandr.pdf
